SiriusXM Removes Another Caution Flag
Well, this is the second trading day in a row that SiriusXM has removed a caution flag. It is an an event that we can not ignore. Remember, the cautions always make the first moves. The wild card we have out there is Liberty Media with room to buy up to about 45 million more shares. Whether they were in the market today can not be known, but in some ways we have to assume that possibility.
With two caution flags removed in two days we have to explore the possibility that the move down to $2.55 was short lived and a bottom… at least for the moment. Remember that Liberty causes a dynamic that makes for a bit of uncertainty.
What we are seeing from a technical standpoint is still bearish in the short and mid term, but we have some small clues that we may see a reversal in process. My only hesitation is that Liberty could be propping things up. Essentially an active trader has to be ready for a bottom to fall out and a trip to $2.65 or so, as well as consolidation and a possible pop up to $2.75 or so. Compounding the issue is that this is a holiday week. We can and very well may see volatility.
Volume
The volume today was moderate to high. The problem is whether or not Liberty was involved. If Liberty was a buyer today then we would have had light volume. If not, we have consolidation volume. Do you see how the Liberty cloud can make a call tough?

Support and Resistance
Key levels are $2.74 and $2.60. We are at the top end of a range today with volume to light to put up a real test. It makes for a tough call. I can see this equity dipping and bouncing off of $2.68 just as easily as I can see it testing $2.74. In fact, I can picture both happening in tomorrows action. The key here is the volume on the moves, and paying attention to the EMA’s. All EMA’s sit inside a range of $2.68 to $2.74. That is a very narrow band, and something is gonna give one way or another. Liberty certainly knows when to become active. Essentially it seems to be that as soon as this equity seems lost on direction, Liberty hops in. Amazingly they are able to acquire millions of shares in a narrow range when they trade like this. Think about it… Liberty accounts for 25% of the volume and the equity can not really pass $2.75!

Exponential Moving Averages – EMA’s
We have some new members, so a quick review of EMA’s is in order. The concept is that when each successive average is higher than the next it is bullish (i.e. the 5 day above the 13, 20, and 50 and so on). If the averages are below it is bearish. Right now we have all of these averages converging. That points to a break one way or the other. The prices in red are caution flags (early indicators). The blocks below are warning flags (where the equity is now).
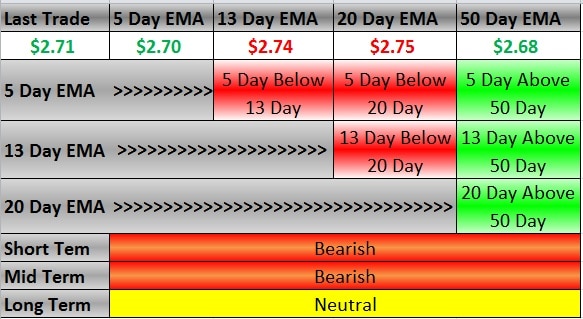
With the EMA’s we are seeing convergence, and as I indicated last week it looks like that will happen at about $2.73, just below resistance at $2.74). It app[ears that this equity is poised for a run to $2.95 or a dip to $2.60 from a pure technical standpoint. The other option is consolidation, but when these averages converge like they have, the equity will typically want to make a move.
Summary
Liberty is a wild card. If we remove Liberty from the equation would the equity have removed two caution flags in the last two sessions? That is the $1 million question! At this point what we can do is assess the range and watch volume closely to determine direction. A move does not really have unless it has 85 million shares behind it. Being an active trader in this environment is not easy. f I am out I do not worry about the upside unless there is big volume behind a move above $2.74. On the down side I do not worry unless there is big volume below $2.68. Thus, I am a buyer on big volume at $2.75 to capture a pop, and a seller if an move goes through $2.68 on big volume.


Spencer — Did you see this story? Could this be a tip of the hat of what’s to come for the US company? It has been Malone’s style to issue a dividend with stocks under the Liberty umbrella. Why would the Canadian subsidiary do it and the US company not eventually follow suit? My instinct says first share buyback, 18-24 months to $5 then stock becomes investment grade and a dividend would make sense for the type of investor Malone would attract. Comments? Would love your thoughts on this as you did hint that a dividend could be possible.
SiriusXM Canada Announces a Special Dividend and Initiation of a Quarterly Dividend Payment
TORONTO, Nov. 19, 2012, 2012 (Menafn – Canada NewsWire via COMTEX) –Canadian Satellite Radio Holdings Inc. (“SiriusXM Canada” or the “Company”) , parent of Sirius XM Canada Inc., today announced that the Company’s Board of Directors has declared a special cash dividend of C0.0825 per Class A Subordinate Voting Share (“Class A Share”) and C0.0275 per Class B Voting Share (“Class B Share”). In addition, the Company has initiated a quarterly cash dividend of C0.0825 per Class A Share and Class C Non-Voting Share (“Class C Share”) and C0.0275 per Class B Share.
The special dividend will have a record date of November 28, 2012 and a payment date of January 2, 2013. The Board of Directors also declared the first quarterly cash dividend to shareholders of record on November 28, 2012, payable on January 2, 2013. Pursuant to the new quarterly dividend policy, subject to Board approval, SiriusXM Canada intends to declare a cash dividend of 0.0825 per Class A and C Share and 0.0275 per Class B Share quarterly with the next dividend declaration in January, 2013.
“The decision to provide a special dividend as well as introduce a quarterly dividend is a strong testament to the proven cash generation capabilities of the business and our excellent growth,” said Mark Redmond, President and CEO, SiriusXM Canada. “We have a stable recurring revenue stream, and we have been able to realize cost synergies without sacrificing growth. We are confident in the Company’s ongoing financial strength, operational efficiency and ability to grow free cash flow. The Board of Directors will continue to #$%$ the quarterly dividend payout level.”
Both the special and quarterly dividends on the Class A Shares and Class B Shares, and any quarterly dividends on the Class C Shares, are designated as an “eligible” dividend for the purposes of the Income Tax Act (Canada) and any similar provincial legislation.
Class B Shares in the Company are convertible at any time at the holder’s option into fully paid and non-#$%$able Class A Shares upon the basis of one ClassA Share for three Class B Shares. The Company has issued 185,879,935 Class B Shares, which represent 61,959,978 Class A Shares based on the aforementioned conversion right. In the event that all Class B Shares are converted to Class A Shares, the total outstanding number of Class A Shares would be 123,154,230. There are currently no Class C Shares outstanding.
Sentiment: Strong Buy
2 users liked this posts 1 users disliked this posts
Reply
Ignore User
|
Report Abuse
Re: SiriusXM Canada Announces a Special Dividend and Initiation of a Quarterly Dividend Payment
By cashbar1 . 6 minutes ago . Permalink
Cola
This is incredible news! A sign of what is coming?
Now if SIRI Canada, a subsidiary of the USA company, is doing it and they are a much smaller company, is this news a tip of the hat of what’s to come here in the USA? I mean, why would SIRI Canada issue a dividend and the USA company not? It is Malone’s style to issue a dividend. That would also push the stock closer towards investment grade at $5 a share and get the real heavyweight institutional investor to pony up their money and buy this stock. Can you tell me which dividend – Class A, B or C — amount is for retail shareholders in the Canadian subsidiary?
Sentiment: Buy
After FCC clearance and two years down the road Spencer, what do you think we can expect SIRI XM to be? Is 2.70 x 2 unrealistic ? What do you see? Ball park figure ?