SiriusXM Get’s A Bit Bearish
SiriusXM held the line at $3.10, but did indeed test waters below that level. Volume has returned to normalized levels, but the upward bias is still somewhat in tact because the overall fundamental story of this equity is still in tact. What we have been experiencing is this equity testing down to lower averages followed by small runs that peak just above the 5 day average.
What you should note is that the 5 day average is retracing a bit. That means that the next run will have some difficulty passing substantially above that level. Essentially, instead of having $3.25 as 1 step away it is now two, and perhaps even three steps away. This is well worth noting because it gives you as an investor early insight as to behavior of the equity.
Volume
The last two sessions have presented us with average volume. We tested below support levels at $3.09 / $3.10. We did not test the support level at about $3.00. The equity actually closed just below the strongest support and resistance level on average volume. There are two things worth noting here. One is that the equity gravitated back up and the other is that the equity held above the next support levels below. Essentially I like the volume I am seeing. We now need the equity to behave in a more bullish pattern in terms of stock price.

Support and Resistance
Support and Resistance is quite interesting. There is room below down to $3.02 and room above at $3.15. The equity sits right at the critical level of $3.10 or $3.11. Thus, the challenge is trying to push up to $3.15 or to hold the level at $3.02. Here is what to watch for., If the equity is trading down in early action a test of $3.02 becomes much more likely. If it trades up, it will be likely to test $3.15. At the moment, a dip below $3.00 is not an instant possibility, but is within three steps. A test of $3.15 is much more likely. Pay close attention to these levels and the volume associated with them. My downside near term target is now $3.02 from $3.10. My near term upside target is now $3.18 from $3.25.

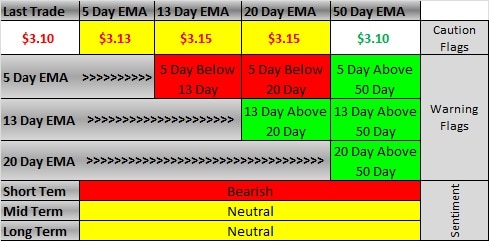
Exponential Moving Averages – EMA’s
The EMA chart is getting a bit more ugly. Gone is all of the green, replaced by yellow and even red. We have three caution flags as well as warning flags. We have possible added caution and warning flags if the equity closes at current levels or below. In fact, we have already tested the 50 day EMA with the close at $3.10 today. The next EMA level below is the 100 day at about $2.95. This is why watching behavior at the support of $3.02 is important. Watch closely.